Comfortable
The app has a wide range of features to make the data evaluation as comfortable as possible.
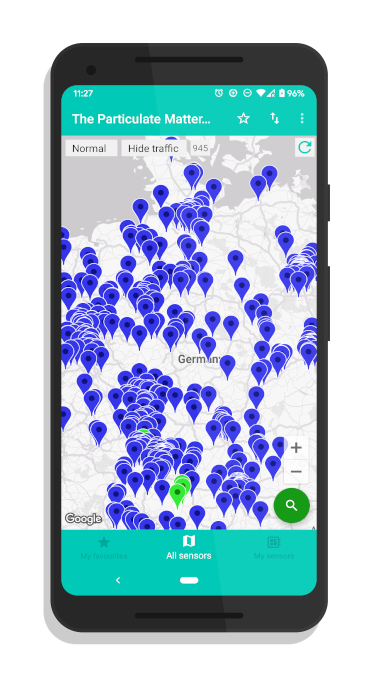
- Map with all sensors
- Compare different sensors
- Link your own sensors
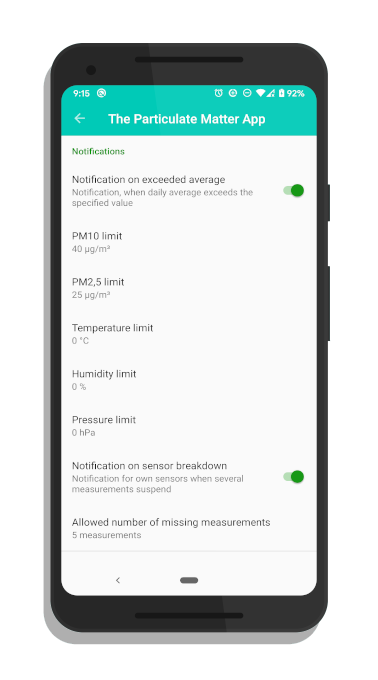
- Notifications on threshold exceedings
- Notifications on threshold exceedings
- Evaluate data comfortable
Flexible
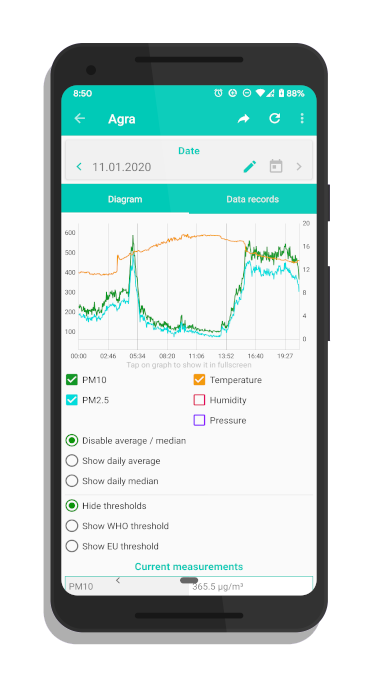
Many useful tools, to display and evaluate measurement data in detail.
- Show measurement data in a graph
- Show measurements as data records
- Show daily average and median
- Export graph and records
- Share sensors
High customizability
The app is highly customizable, to ensure a great look and feel.
- Homescreen widget
- Adjustable thresholds with notifications.
- Automatic error correction.
- Adjustable sync cycle.
- Dark mode.
- Notification on sensor breakdown.